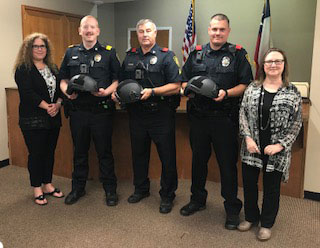
Bonham Police Department receives Ballistic Helmets from TCOG
May 3, 2018TCOG’s ADRC Announces New Educational Series
June 6, 20182019-2021 Community Needs Assessment

Quantitative Data
Poverty
Poverty in the Texoma region is masked by the official Census Bureau county-level findings. As shown in Table 2, below, the overall poverty level of each of the three counties is close to the poverty level of the State of Texas, and the entire United States.
| Cooke | 15.0% |
| Fannin | 16.5% |
| Grayson | 15.6% |
| Texas | 16.7% |
| US | 15.1% |
| Source: US Census Bureau, 2012-2016 American Community Survey 5-Year Estimates | |
However the aggregate numbers do not tell the story of poverty in the Texoma region. Poverty in all three counties is defined by demographic variables (who you are), and geographic variables (where you are), and the two sets overlap. The result is what we term “Pockets of Poverty.” This will become apparent in the following sections of this assessment document.
Demographic Variables and Poverty
Age
Age is a major determinate of poverty throughout the region. Table 3 below shows how poverty is distributed across age categories in Grayson County.
| Table 3: Poverty and Age, Grayson County | |||
|---|---|---|---|
| Subject | Grayson County, Texas | ||
| Total | Below poverty level | Percent below poverty level | |
| Estimate | Estimate | Estimate | |
| Population for whom poverty status is determined | 121,291 | 18,877 | 15.6% |
| AGE | |||
| Under 18 years | 28,968 | 6,490 | 22.4% |
| Under 5 years | 7,531 | 1,853 | 24.6% |
| 5 to 17 years | 21,437 | 4,637 | 21.6% |
| Related to children of householder under 18 years | 28,803 | 6,325 | 22.0% |
| 18 to 64 years | 72,106 | 10,700 | 14.8% |
| 18 to 34 years | 24,620 | 4,773 | 19.4% |
| 35 to 64 years | 47,486 | 5,927 | 12.5% |
| 60 years and over | 28,130 | 2,433 | 8.6% |
| 65 years and over | 20,217 | 1,687 | 8.3% |
| Source: US Census Bureau, 2012-2016 American Community Survey 5-year Estimates | |||
As shown, the age category with the highest percentage in poverty (24.6%) is under five years in fact 22.4 percent of children in Grayson County live in poverty. This issue of child poverty is pervasive throughout the region, and will be addressed further along with some of the geographic variables. Contrary to popular opinion, the elderly have some of the lowest percentages in poverty, as shown by 8.6 percent of those aged 60 and above estimated to live in poverty, and 8.3 percent for those aged 65 and above. One interesting trend found across all three counties is the percentage of age 18 to 34 years living in poverty; in the case of Grayson County, 19.4 percent. This trend is disturbing, as individuals in this age category are beginning careers, building families, and having children. In another, contemporary, project conducted by TCOG for a city in the region, this age category was significantly under-represented in relation to state and national percentages. Preliminary analysis indicates that the better educated, upwardly mobile, individuals may be moving out of some of the cities in the region, leaving the less educated, (fixed-base) individuals in these cities, and in the region. This will be demonstrated in the age/poverty tables below.
Table 4 shows the breakdown of poverty by age in Fannin County. Again, the age category with the highest percentage in poverty is under 5 years, with the same trends as Grayson County. Once more, the age category 18 to 34 years has a relatively high percentage of individuals in poverty, an estimated 20.9 percent.
| Table 4: Poverty and Age, Fannin County | |||
|---|---|---|---|
| Subject | Fannin County, Texas | ||
| Total | Below poverty level | Percent below poverty level | |
| Estimate | Estimate | Estimate | |
| Population for whom poverty status is determined | 30,792 | 5,078 | 16.5% |
| AGE | |||
| Under 18 years | 7,078 | 1,407 | 19.9% |
| Under 5 years | 1,690 | 386 | 22.8% |
| 5 to 17 years | 5,388 | 1,021 | 18.9% |
| Related to children of householder under 18 years | 7,042 | 1,371 | 19.5% |
| 18 to 64 years | 18,066 | 3,125 | 17.3% |
| 18 to 34 years | 5,631 | 1,178 | 20.9% |
| 35 to 64 years | 12,435 | 1,947 | 15.7% |
| 60 years and over | 7,700 | 853 | 11.1% |
| 65 years and over | 5,648 | 546 | 9.7% |
| Source: US Census Bureau, 2012-2016 American Community Survey 5-year Estimates | |||
Table 5 shows the same data for Cooke County. In Cooke County, 25 percent of children under the age of 18 live below the official poverty line, and 28.8 percent of children under 5 years are living in poverty. In fact, all of the childhood age categories in Cooke County indicate relatively high percentages in poverty. However, only 5.2 percent of Cooke County residents 65 years and older live in poverty. The age category 18 to 34 has a relatively high percentage in poverty, 22.1%.
This trend could possibly represent the working poor, those who have only part-time jobs, or low-paying jobs without benefits. Clearly this trend deserves further investigation.
When summarized across the three counties, the most vulnerable in society, children, and especially the youngest children, are more likely to live in poverty. As noted, those in the age categories 60 and older, and 65 and older, are the least likely to live in poverty. A disturbing trend of relatively high poverty in the age category 18 to 34 years is found, which needs further investigation.
| Table 5: Poverty and Age, Cooke County | |||
|---|---|---|---|
| Subject | Cooke County, Texas | ||
| Total | Below poverty level | Percent below poverty level | |
| Estimate | Estimate | Estimate | |
| Population for whom poverty status is determined | 38,050 | 5,726 | 15.0% |
| AGE | |||
| Under 18 years | 9,069 | 2,269 | 25.0% |
| Under 5 years | 2,462 | 710 | 28.8% |
| 5 to 17 years | 6,607 | 1,559 | 23.6% |
| Related to children of householder under 18 years | 9,029 | 2,229 | 24.7% |
| 18 to 64 years | 22,484 | 3,121 | 13.9% |
| 18 to 34 years | 7,771 | 1,720 | 22.1% |
| 35 to 64 years | 14,713 | 1,401 | 9.5% |
| 60 years and over | 9,355 | 647 | 6.9% |
| 65 years and over | 6,497 | 336 | 5.2% |
| Source: US Census Bureau, 2012-2016 American Community Survey 5-year Estimates | |||
Racial/Ethnic Variables
Table 6, below, shows poverty by race/ethnicity for Grayson County.
| Table 6: Race and Poverty, Grayson County | |||
|---|---|---|---|
| Subject | Grayson County, Texas | ||
| Total | Below poverty level | Percent below poverty level | |
| Estimate | Estimate | Estimate | |
| Population for whom poverty status is determined | 121,291 | 18,877 | 15.6% |
| SEX | |||
| Male | 59,276 | 8,702 | 14.7% |
| Female | 62,015 | 10,175 | 16.4% |
| RACE AND HISPANIC OR LATIN ORIGIN | |||
| White alone | 105,260 | 14,377 | 13.7% |
| Black or African American alone | 7,051 | 2,510 | 35.6% |
| American Indian and Alaska Native alone | 1,410 | 152 | 10.8% |
| Asian alone | 1,326 | 277 | 20.9% |
| Native Hawaiian and Other Pacific Islander alone | 76 | 9 | 11.8% |
| Some other race alone | 2,564 | 604 | 23.6% |
| Two or more races | 3,604 | 948 | 26.3% |
| Hispanic or Latino origin (of any race) | 15,009 | 3,395 | 22.6% |
| White alone, not Hispanic or Latino | 93,246 | 11,733 | 12.6% |
| Source: US Census Bureau, 2012-2016 American Community Survey 5-year Estimates | |||
There is a relatively large difference in the percentage in poverty between the two numerically largest categories. The estimated percentage in poverty of Blacks (or African Americans) living in poverty is 35.6, while the estimated percentage of Whites living in poverty is 12.6 percent. Also notable are the percentages for Hispanic or Latino (22.6 percent), two or more races (26.3 percent), and some other race (23.6 percent). Thus, people of color are more likely to live in poverty than Whites – with the one exception of American Indians, with 10.8 percent in poverty. Numerically, however, 11,733 Whites live in poverty, while 2,510 Blacks are in poverty.
Table 7 shows poverty by race/ethnicity for Fannin County. Again, people of color are more likely to live in poverty.
| Table 7: Race and Poverty, Fannin County | |||
|---|---|---|---|
| Subject | Fannin County, Texas | ||
| Total | Below poverty level | Percent below poverty level | |
| Estimate | Estimate | Estimate | |
| Population for whom poverty status is determined | 30,792 | 5,078 | 16.5% |
| SEX | |||
| Male | 15,122 | 2,474 | 16.4% |
| Female | 15,670 | 2,604 | 16.6% |
| RACE AND HISPANIC OR LATIN ORIGIN | |||
| White alone | 27,897 | 3,976 | 14.3% |
| Black or African American alone | 1,559 | 661 | 42.4% |
| American Indian and Alaska Native alone | 105 | 22 | 21.0% |
| Asian alone | 165 | 62 | 37.6% |
| Native Hawaiian and Other Pacific Islander alone | 11 | 0 | 0.0% |
| Some other race alone | 203 | 147 | 72.4% |
| Two or more races | 852 | 210 | 24.6% |
| Hispanic or Latino origin (of any race) | 2,817 | 679 | 24.1% |
| White alone, not Hispanic or Latino | 25,392 | 3,440 | 13.5% |
| Source: US Census Bureau, 2012-2016 American Community Survey 5-year Estimates | |||
In Fannin County the poverty gap between people of color and Whites is even greater, with an estimated 42.4 percent of Blacks living below the poverty level, and 13.5 percent of Whites living below the poverty line. Numerically, however, there are an estimated 3,440 Whites in poverty, and an estimated 661 Blacks in poverty.
Table 8, below, shows the same data for Cooke County. However, the information about Cooke County displays a somewhat different pattern than seen in Grayson and Fannin Counties.
| Table 8: Race and Poverty, Cooke County | |||
|---|---|---|---|
| Subject | Cooke County, Texas | ||
| Total | Below poverty level | Percent below poverty level | |
| Estimate | Estimate | Estimate | |
| Population for whom poverty status is determined | 38,050 | 5,726 | 15.0% |
| SEX | |||
| Male | 18,860 | 2,511 | 13.3% |
| Female | 19,190 | 3,215 | 16.8% |
| RACE AND HISPANIC OR LATIN ORIGIN | |||
| White alone | 35,389 | 5,176 | 14.6% |
| Black or African American alone | 903 | 182 | 20.2% |
| American Indian and Alaska Native alone | 230 | 37 | 16.1% |
| Asian alone | 296 | 37 | 12.5% |
| Native Hawaiian and Other Pacific Islander alone | 44 | 0 | 0.0% |
| Some other race alone | 280 | 21 | 7.5% |
| Two or more races | 908 | 273 | 30.1% |
| Hispanic or Latino origin (of any race) | 6,428 | 2,441 | 38.0% |
| White alone, not Hispanic or Latino | 29,385 | 2,834 | 9.6% |
| Source: US Census Bureau, 2012-2016 American Community Survey 5-year Estimates | |||
As shown in Table 8, Hispanics have the highest percentage living in poverty, with 38.0 percent, and the number of Hispanics in poverty is relatively high, at 2,441. In contrast, the 2,834 Whites living in poverty in Cooke County are only 9.6 percent of the White population of Cooke County.
One thing is consistent across all three counties: minorities, or people of color, are more likely to live in poverty than Whites.
Education
Perhaps the strongest correlate of poverty in the Texoma region is the educational level of the residents.
Table 9 shows the percentage of each educational level in poverty status, for all three counties.
| Table 9: Educational and Poverty, Cooke, Fannin and Grayson counties | |||
|---|---|---|---|
| Subject | Cooke County, Texas | ||
| Total | Below poverty level | Percent below poverty level | |
| Estimate | Estimate | Estimate | |
| Population for whom poverty status is determined | 38,050 | 5,726 | 15.0% |
| EDUCATIONAL ATTAINMENT | |||
| Population 25 years and over | 25,657 | 2,674 | 10.4% |
| Less than high school graduate | 3,425 | 940 | 27.4% |
| High school graduate (includes equivalency) | 7,646 | 807 | 10.6% |
| Some college, associate’s degree | 8,994 | 798 | 8.9% |
| Bachelor’s degree or higher | 5,592 | 129 | 2.3% |
| Subject | Fannin County, Texas | ||
| Total | Below poverty level | Percent below poverty level | |
| Estimate | Estimate | Estimate | |
| Population for whom poverty status is determined | 30,792 | 5,078 | 16.5% |
| EDUCATIONAL ATTAINMENT | |||
| Population 25 years and over | 21,232 | 3,059 | 14.4% |
| Less than high school graduate | 3,029 | 881 | 29.1% |
| High school graduate (includes equivalency) | 7,539 | 1,177 | 15.6% |
| Some college, associate’s degree | 7,128 | 856 | 12.0% |
| Bachelor’s degree or higher | 3,536 | 145 | 4.1% |
| Subject | Grayson County, Texas | ||
| Total | Below poverty level | Percent below poverty level | |
| Estimate | Estimate | Estimate | |
| Population for whom poverty status is determined | 121,291 | 18,877 | 15.6% |
| EDUCATIONAL ATTAINMENT | |||
| Population 25 years and over | 82,185 | 10,209 | 12.4% |
| Less than high school graduate | 10,055 | 2,656 | 26.4% |
| High school graduate (includes equivalency) | 25,291 | 3,492 | 13.8% |
| Some college, associate’s degree | 30,147 | 3,169 | 10.5% |
| Bachelor’s degree or higher | 16,692 | 892 | 5.3% |
| Source: US Census Bureau, 2012-2016 American Community Survey 5-year Estimates | |||
As shown in Table 9, those with less than a high school degree are more likely to be in poverty; those with a Bachelor’s degree are much less likely. This correlation will be addressed more fully later in this report.
Family Poverty Data
Poverty status varies greatly by family status, and whether children are present in the family. Age and number of children are also variables that contribute to families living in poverty. This is demonstrated in Table 10, for Grayson County.
| Table 10: Family Status, Number of Children in Household, and Poverty, Grayson County | ||||||
|---|---|---|---|---|---|---|
| Subject | Grayson County, Texas | |||||
| All families | Married-couple families | Female householder, no husband present | ||||
| Total | Percent below poverty level | Total | Percent below poverty level | Total | Percent below poverty level | |
| Estimate | Estimate | Estimate | Estimate | Estimate | Estimate | |
| Families | 32,311 | 12.0% | 23,795 | 5.9% | 6,178 | 31.9% |
| With related children of householder under 18 | 15,104 | 20.4% | 9,349 | 9.7% | 4,226 | 41.6% |
| With related children of householder under 5 | 2,592 | 25.0% | 1,523 | 10.8% | 733 | 39.6% |
| With related children of householder under 5 and 5 to 17 years | 3,366 | 26.5% | 2,328 | 18.4% | 913 | 48.4% |
| With related children of householder 5 to 17 years | 9,146 | 16.9% | 5,498 | 5.8% | 2,580 | 39.8% |
| Source: US Census Bureau, 2012-2016 American Community Survey 5-year Estimates | ||||||
As shown in Table 10, married-couple families are much less likely to be in poverty than families with a female householder, especially if children are present. In fact, nearly half (48.4 percent) of female-headed households, with children under 5, and 5 to 17 are living in poverty. Table 11, below, shows the same data for Fannin County.
| Table 11: Family Status, Number of Children in Household, and Poverty, Fannin County | ||||||
|---|---|---|---|---|---|---|
| Subject | Fannin County, Texas | |||||
| All families | Married-couple families | Female householder, no husband present | ||||
| Total | Percent below poverty level | Total | Percent below poverty level | Total | Percent below poverty level | |
| Estimate | Estimate | Estimate | Estimate | Estimate | Estimate | |
| Families | 8,557 | 12.4% | 6,573 | 7.4% | 1,410 | 32.3% |
| With related children of householder under 18 | 3,681 | 20.4% | 2,446 | 11.3% | 926 | 42.7% |
| With related children of householder under 5 | 630 | 25.2% | 331 | 8.5% | 166 | 54.2% |
| With related children of householder under 5 and 5 to 17 years | 768 | 23.0% | 581 | 11.0% | 134 | 81.3% |
| With related children of householder 5 to 17 years | 2,283 | 18.2% | 1,534 | 12.1% | 626 | 31.3% |
| Source: US Census Bureau, 2012-2016 American Community Survey 5-year Estimates | ||||||
For Fannin County, the trends are even more disturbing. Female-headed households with no husband present are much more likely to be in poverty than married-couple households. For example 11.0 percent of married-couple families with children under 5 and 5 to 17 years are estimated to be living in poverty; 81.3 percent of female headed families with children under 5 and 5 to 17 are estimated to be living in poverty.
Table 12 shows the same information for Cooke County.
| Table 12: Family Status, Number of Children in Household, and Poverty, Cooke County | ||||||
|---|---|---|---|---|---|---|
| Subject | Cooke County, Texas | |||||
| All families | Married-couple families | Female householder, no husband present | ||||
| Total | Percent below poverty level | Total | Percent below poverty level | Total | Percent below poverty level | |
| Estimate | Estimate | Estimate | Estimate | Estimate | Estimate | |
| Families | 10,554 | 11.0% | 8,441 | 6.0% | 1,509 | 38.0% |
| With related children of householder under 18 | 4,559 | 20.5% | 3,239 | 11.9% | 1,021 | 47.7% |
| With related children of householder under 5 | 631 | 13.6% | 398 | 3.5% | 197 | 36.5% |
| With related children of householder under 5 and 5 to 17 years | 1,216 | 39.7% | 809 | 25.8% | 238 | 87.8% |
| With related children of householder 5 to 17 years | 2,752 | 13.7% | 2,032 | 7.9% | 586 | 35.2% |
| Source: US Census Bureau, 2012-2016 American Community Survey 5-year Estimates | ||||||
The same patterns persist, with female-headed families with children showing high percentages in poverty. Clearly, the most vulnerable are children in female-headed families.
The results of this demographic analysis indicate that poverty is more pervasive among the young, the less well educated, families with children (especially female-headed households) and the non-white population of the region. Perhaps the most vulnerable are young minority, children, with siblings, in a female-headed household.
Geographic Variables and Poverty
Poverty in the Texoma region is not only defined by demographic variables, but by geographic variables as well. Poverty in Texoma is concentrated in “pockets” of poverty. These pockets can be mapped using several variables, such as childhood poverty, family poverty, and uninsured individuals. These variables, all indicators of poverty, tend to be concentrated consistently in the same areas of the counties and towns in the region. The following maps, taken from Community Commons using American Community Survey Estimates 2016, demonstrate very clearly where the pockets of poverty are in each county in the region.
Mapping Childhood Poverty
Grayson County
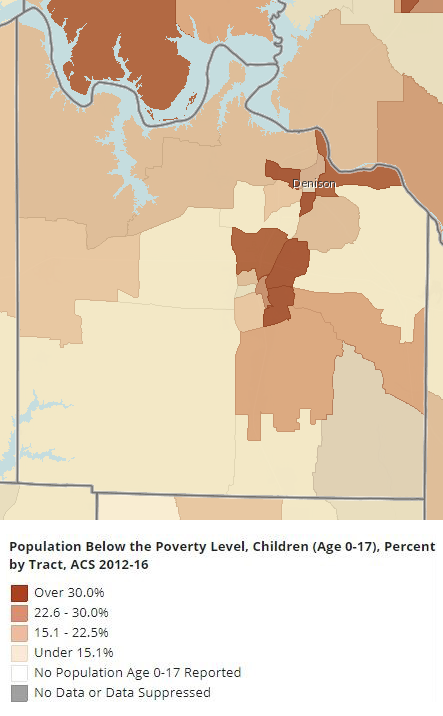
Figure B: Childhood Poverty Map, Grayson County
Source: Community Commons, ACS 212-2016
For all of the childhood poverty maps, the darker the shade of brown, the higher percentage of children aged 0 – 17 estimated by the Census Bureau to be living in poverty.
As indicated in Figure B, childhood poverty is concentrated in three census tracts in north, northeast, and east Sherman, as well as south, east/northeast and west in Denison. The map below shows where these tracts are located in the City of Sherman. The two tracks with the highest percentage of children in poverty are in east Sherman (46.3%) and northeast Denison, and along the Red River.
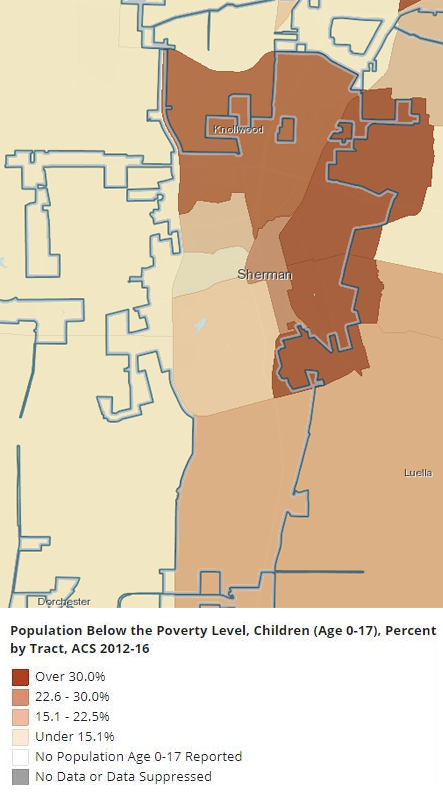
The census tract in the northern part of Sherman and Knollwood (tract 9.02) has an estimated 31.73 percent of children 0-17 living in poverty. The tract in the northeast part of Sherman (tract 14) has an estimated 32.49 percent of children living in poverty, while the tract in east Sherman (tract 15) indicates an estimated 46.32 of children living in poverty; data also indicate that 49.36 percent of children ages 0 – 4 in this tract live in poverty. Clearly, as measured by childhood poverty, there are distinct “pockets of poverty” in Sherman. The map below shows the same data for the City of Denison.
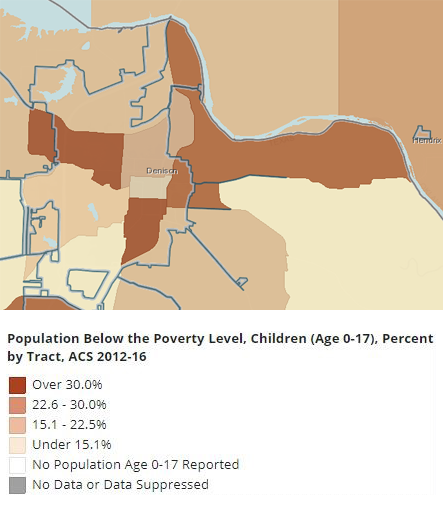
The census tract in west Denison (tract 4), indicates that an estimated 38.44 percent of children ages 0-17 are living in poverty. The tract in the south of Denison (tract 7) shows 30.25 percent of children in poverty. The large tract in east Denison, running up to the Red River just down from the Denison Dam, and over to the Red River just below Hendrix, Oklahoma (tract 2) has an estimated 43.52 percent of children living in poverty. As in the case of Sherman, there are clear pockets of poverty.
Fannin County
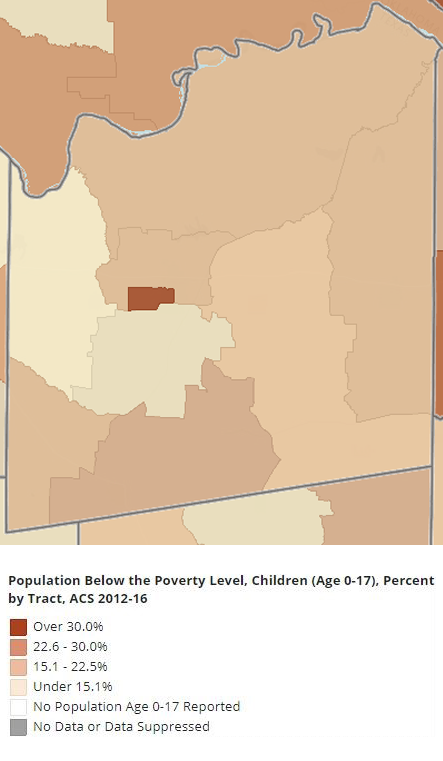
Figure C: Childhood Poverty Map, Fannin County
Source: Community Commons, ACS 212-2016
In Fannin County, as shown in Figure C, childhood poverty seems to be concentrated in west Bonham, but other sections seem relatively high as well. The census tract in the central south part of Fannin County (tract 9507.01) has an estimated 21.1 percent of children ages 0-17 living in poverty, while the tract in the southwest corner of the county has an estimated 21.2 percent of children living in poverty. The map of Bonham, Figure C.1, below, shows where childhood poverty is concentrated in Bonham.
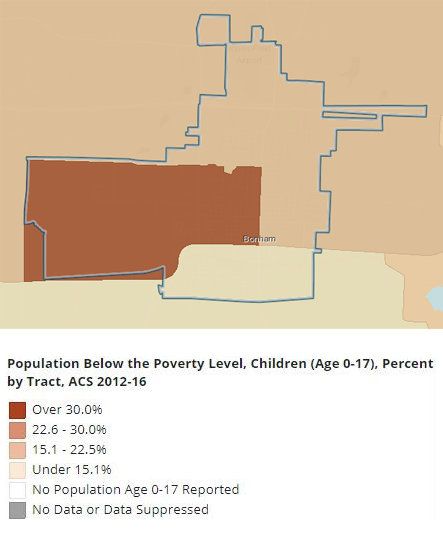
Childhood poverty in Bonham is concentrated in the center and west parts of the city, in tract 9504.01. The data indicate an estimated 38.87 percent of children in this part of the city live in poverty. Again, there seems to be a pocket of poverty, as measured by childhood poverty, in Bonham.
Cooke County
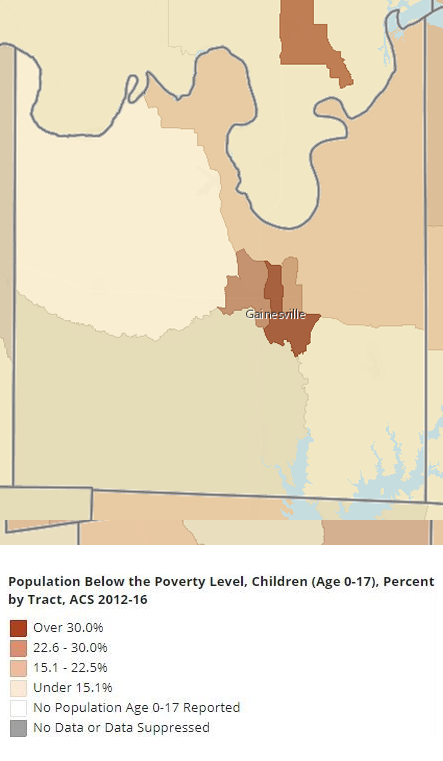
Figure D: Childhood Poverty Map, Cooke County
Source: Community Commons, ACS 212-2016
As shown in Figure D, childhood poverty tends to be greatest in Gainesville, and concentrated in central and south Gainesville. Figure D.1, below, shows childhood poverty in Gainesville in more detail.
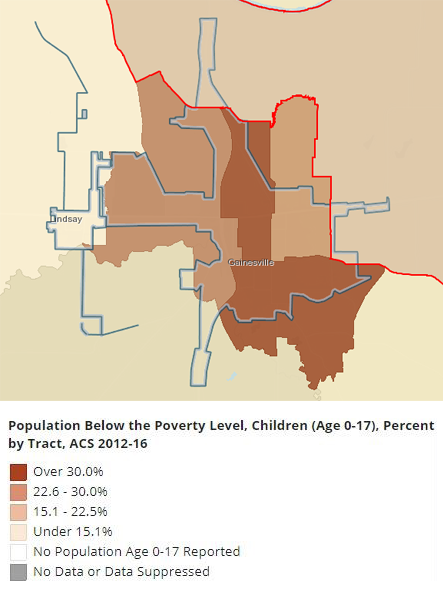
The tract in south Gainesville, extending out into unincorporated area (tract 11), has an estimated 55.1 percent of children 0-17 living in poverty, while the tract in central Gainesville (tract 5) has an estimated 64.5 percent of children living in poverty, one of the highest concentrations in the region. Other ACS data indicate that 70.56 percent of children ages 0 – 4 in tract 5 live in poverty. The east part of Gainesville, tract 6, has an estimated 23.52 percent of children in poverty; other ACS data indicate that 32.68 percent of children ages 0 – 4 in tract 6 live in poverty. The west part of Gainesville, tract 4, has 22.60 percent of children living in poverty.
Mapping Family Poverty
Grayson County
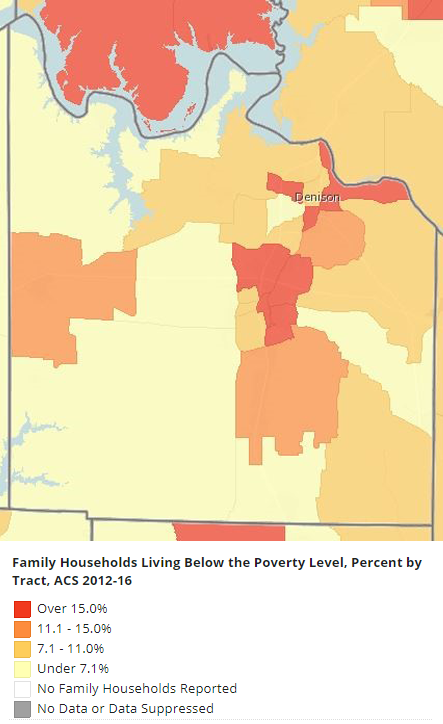
Figure E: Families in Poverty, Grayson County
Source: Community Commons, ACS 212-2016
As expected, the same census tracts in Sherman and Denison that indicate higher levels of families in poverty also have higher levels of childhood poverty. The highest concentration of family poverty is the south-east tract in Sherman, with 32.6% of families below the poverty level. Figure E.1, below shows details of family poverty by census tract for Sherman.
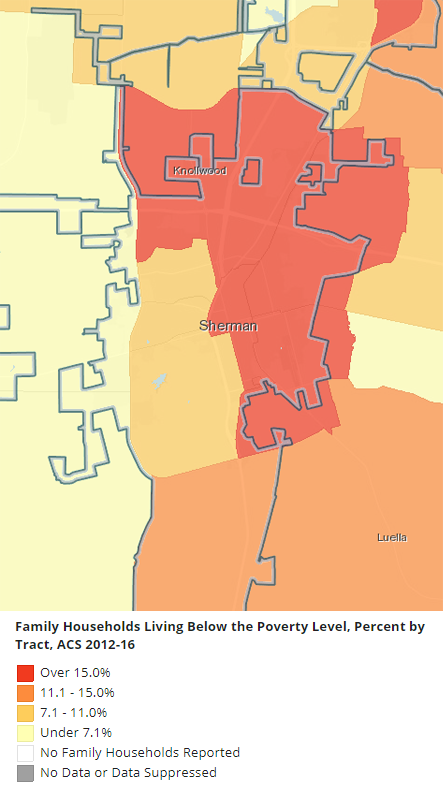
Tract 9.02, in the northwest part of Sherman and Knollwood, has an estimated 20.6 percent of families living in poverty. In tract 14 in east Sherman, 23.9 percent of families are living in poverty, while in south Sherman (tract 15), an estimated 32.6 percent of families are living in poverty. Again, the same tracts having higher percentages of childhood poverty also have higher percentages of family poverty. Figure E.2, below shows the distribution of family poverty in Denison and the surrounding area.
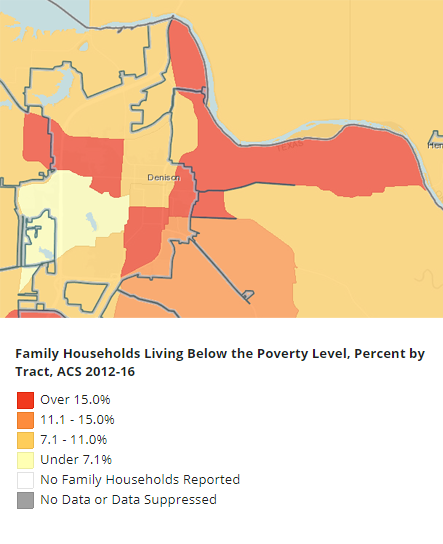
As expected, family poverty tends to be concentrated in the same areas as childhood poverty. Census tract 4, in the northwest part of the city, has 16.3 percent of families estimated to be living in poverty. Tract 8, in the southeast of Denison, has an estimated 24.6 percent of families in poverty, while tract 2, in the northeast part of the city, has an estimated 29.1 percent of families in poverty.
Fannin County
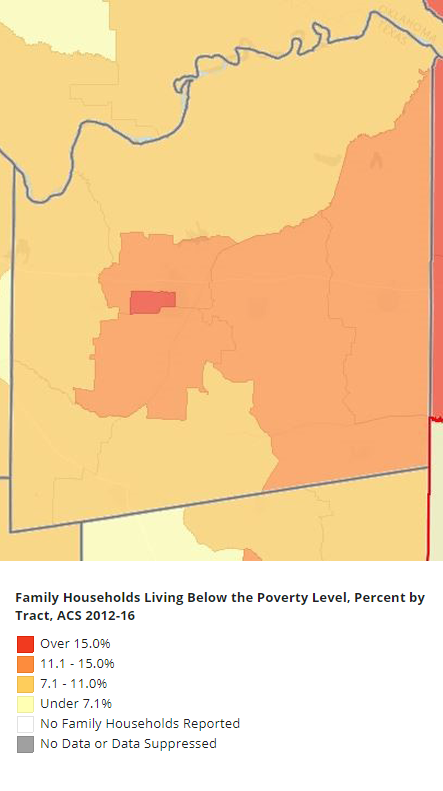
Figure F: Families in Poverty, Fannin County
Source: Community Commons, ACS 212-2016
Figure F, above, again indicates that family poverty is concentrated in west Bonham. This census tract (tract 9504.01) has an estimated 28.82 percent of families living below the poverty level. For this variable, tracts in the eastern part of the county show higher levels of family poverty than northern, western, and southwest parts of the county.
Cooke County
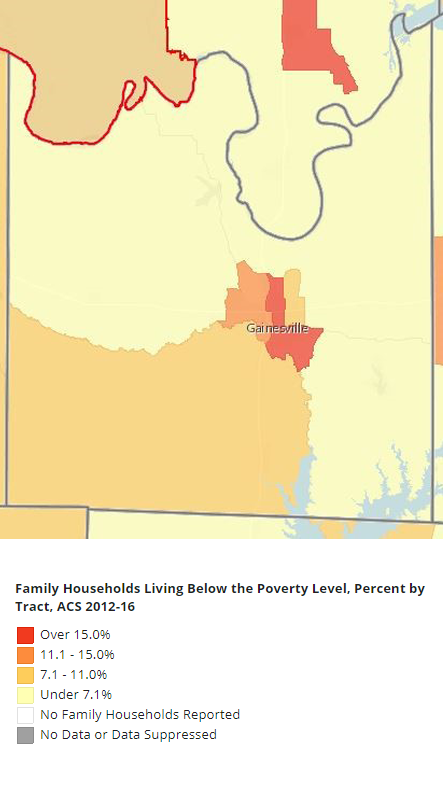
Figure G: Families in Poverty, Cooke County
Source: Community Commons, ACS 212-2016
Again, as expected, family poverty is concentrated in the same areas of Cooke County as childhood poverty. Figure G.1, below, shows the distribution for the Gainesville area.
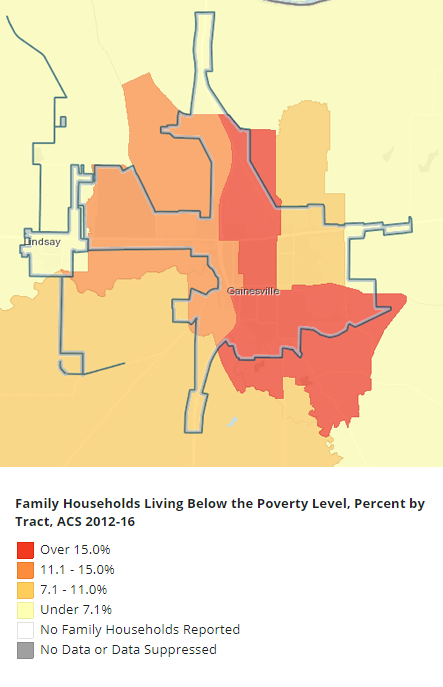
Again, as expected, the same tracts having higher childhood poverty also have higher family poverty. Tract 11, in the southwest part of Gainesville, has an estimated 24.32 percent of families living in poverty, and tract 5, in the central part of the city, has an estimated 36.30 percent of families living in poverty.
Geographical Conclusions
Numerous other variables indicating poverty, some found in Appendix A of this report, all validate the concept of pockets of poverty in the region. West Bonham, northwest, northeast and south Sherman, south, northeast and northwest Denison, and southeast and central Gainesville are the areas where poverty is concentrated in the Texoma region.
Table 13 below summarizes the pockets of poverty in the Texoma region by poverty variables.
| Table 13: Selected Poverty Indicator Variables by Selected Pockets of Poverty Census Tracts | |||||||||||
|---|---|---|---|---|---|---|---|---|---|---|---|
| Poverty Variable | Grayson County | Fannin County | Cooke County | ||||||||
| Sherman | Denison | Bonham | Gainesville | ||||||||
| Tract 9.02 | Tract 14 | Tract 15 | Tract 4 | Tract 7 | Tract 2 | Tract 9504.01 | Tract 11 | Tract 4 | Tract 5 | Tract 6 | |
| Children Age 0-17 Below Poverty Level | 31.7% | 32.5% | 46.3% | 38.4% | 30.3% | 43.5% | 38.9% | 55.1% | 22.6% | 64.5% | 25.3% |
| Number | 375 | 383 | 1,126 | 364 | 314 | 326 | 281 | 964 | 125 | 571 | 278 |
| Children Age 0-4 Below Poverty Level | 36.7% | 23.9% | 49.4% | 27.7% | 15.0% | 19.1% | 27.2% | 55.0% | 11.1% | 70.6% | 32.7% |
| Number | 102 | 88 | 464 | 97 | 46 | 30 | 56 | 288 | 24 | 175 | 133 |
| Family Households Below Poverty Level | 2.1% | 23.9% | 32.6% | 16.3% | 24.6% | 29.1% | 28.8% | 24.3% | 14.9% | 36.3% | 10.2% |
| Number | 353 | 263 | 593 | 142 | 240 | 185 | 179 | 420 | 66 | 253 | 134 |
| Female Single Parent Households Below Poverty Level | 48.5% | 52.1% | 46.7% | 20.8% | 35.5% | 52.8% | 45.8% | 46.5% | 41.5% | 63.9% | 40.7% |
| Number | 205 | 151 | 207 | 216 | 141 | 86 | 87 | 141 | 49 | 147 | 92 |
| Persons with Income Under $25,000 | 40.2% | 55.8% | 54.2% | 44.3% | 61.5% | 57.6% | 45.0% | 42.9% | 51.8% | 61.3% | 40.7% |
| Number | 2,378 | 2,293 | 2,936 | 1,142 | 1,915 | 1,007 | 1,877 | 2,148 | 830 | 1,595 | 1,443 |
| Households with Income Under $25,000 | 28.5% | 37.1% | 36.4% | 28.8% | 42.8% | 48.2% | 44.3% | 25.1% | 29.8% | 42.5% | 21.2% |
| Number | 821 | 579 | 858 | 375 | 656 | 448 | 447 | 583 | 195 | 569 | 386 |
| Minority Population (Non-White) | 22.4% | 20.5% | 26.0% | 17.5% | 26.5% | 19.1% | 28.0% | 7.2% | 22.3% | 13.0% | 15.4% |
| Number | 1,513 | 1,058 | 1,931 | 592 | 1,061 | 464 | 1,345 | 467 | 454 | 446 | 714 |
| Source: Community Commons, ACS 2012-2016 | |||||||||||
When viewed across variables, several tracts stand out. Tract 15, in Sherman, has notably high percentages, and numbers, of children in poverty, female-headed households in poverty, and personal, and household incomes under $25,000. Tract 7 in Denison has an estimated 61.5 percent of its population, or 1,915 people, earning less than $25,000; tract 9504.01 in Bonham has an estimated 45 percent of its population, or 1,877 people, earning less than $25,000. Tracts 11 and 5 in Gainesville indicate some relatively high percentages and numbers for all variables in the table.