TxCDBG
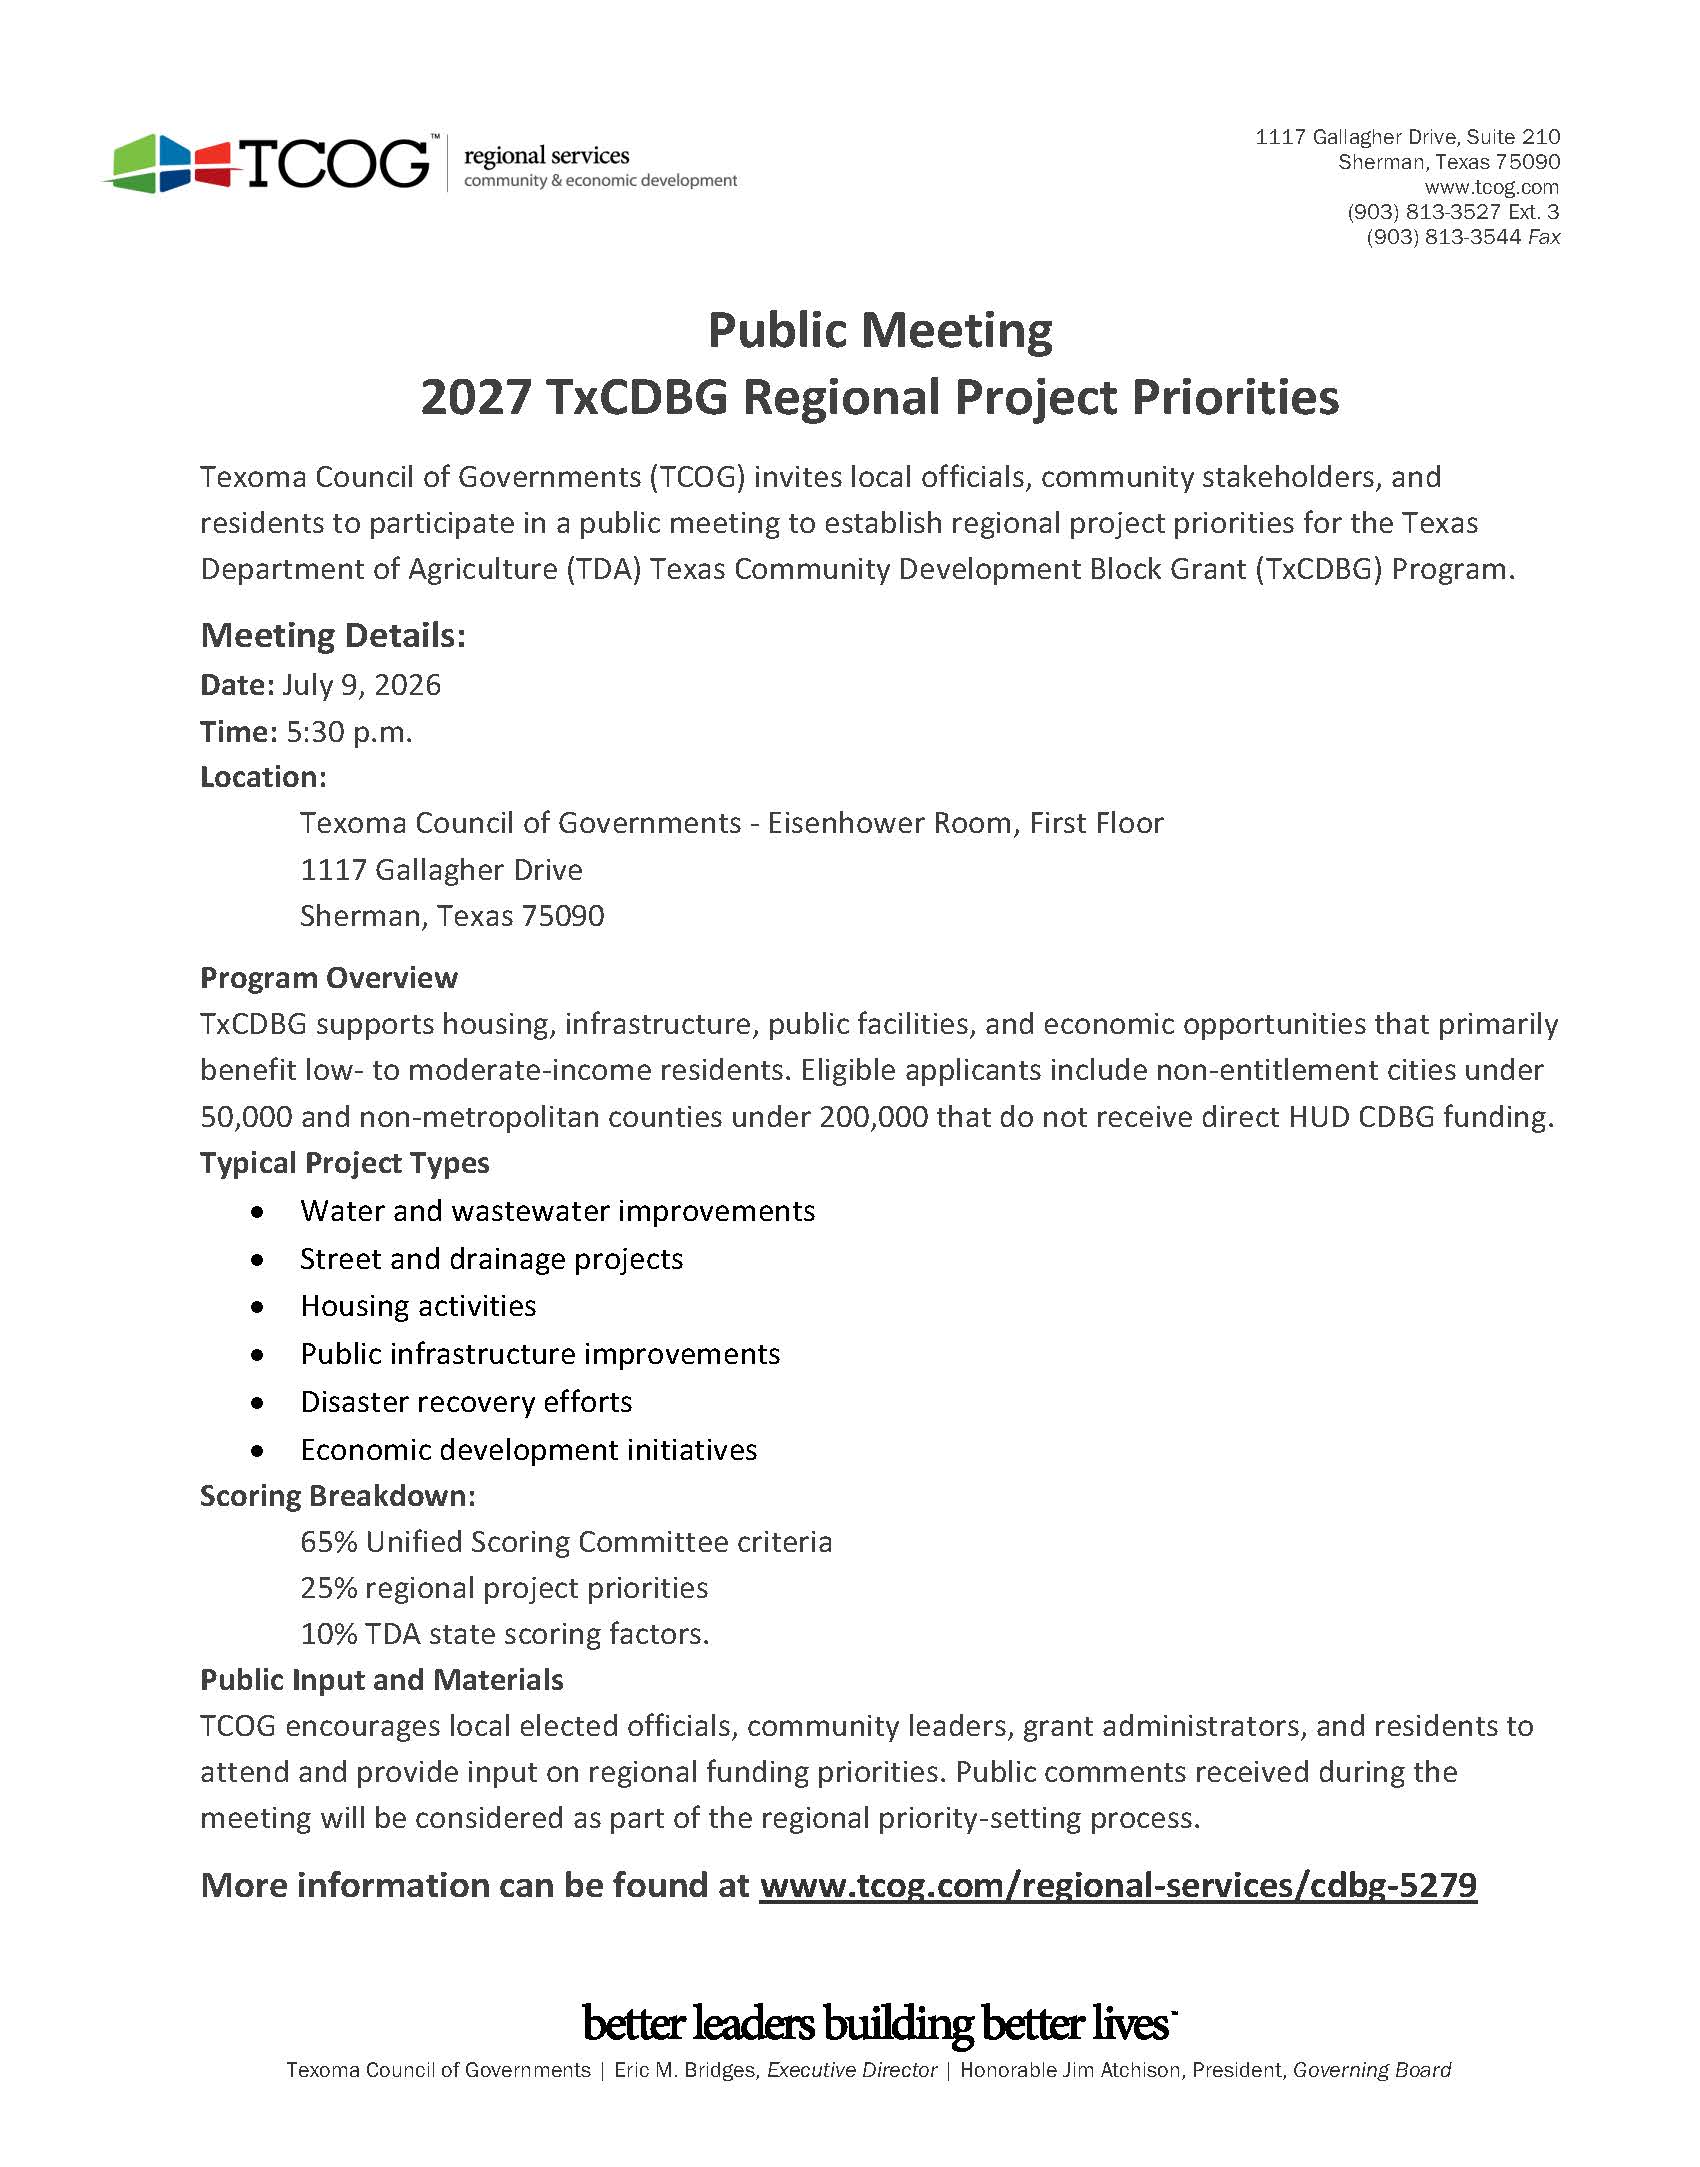
The Texas Community Development Block Grant Program supports our communities and region by providing public infrastructure, suitable living environments, and expanding economic opportunities, principally for persons of low and moderate income.
All non-entitlement cities and counties in the TCOG region are eligible for these funds which come to the Texas Department of Agriculture from the U.S. Department of Housing & Urban Development (HUD).
Annually, the TCOG region receives a formula-based allocation of funds for which applicants can compete. The CDBG applications are scored based on criteria developed by the Unified Scoring Committee (USC), which is composed of one representative from each Council of Governments in the state, and points allocated by Texas Department of Agriculture (TDA). Grants are awarded to the highest-ranking applications. Projects are funded until all available money is expended from that cycle.
TCOG staff also provides technical assistance, support, and data for cities and counties in our region with CDBG grant applications and other programs.

Collaboration, and Community Engagement
The Community Development Block Grant (CDBG) Program supports community development activities to build stronger and more resilient communities.
To support community development, activities are identified through an ongoing process. Activities may address needs such as infrastructure, economic development projects, public facilities installation, community centers, housing rehabilitation, public services, clearance/acquisition, microenterprise assistance, code enforcement, homeowner assistance, etc.
Click here for listing of 2026 TxCDBG Events
Click here for upcoming TxCDBG Award Announcements and Deadlines
Community Development Block Grant 2026 Income Limits
HUD has released the 2026 Income Limits, used to determine eligibility of projects for Community Development Block Grant applications. TDA has updated the Income Survey Questionnaires posted to the TDA Beneficiary Documentation webpage.
The income released by HUD were effective May 1, 2026.
- A survey questionnaire completed using 2025 income limits between May 1, 2026, and May 15, 2026, may be submitted with the application or other survey documentation. TDA will review and determine whether an updated questionnaire is required.
- Survey questionnaires completed on or after May 16, 2026, must use the questionnaire that reflects 2026 income limits.
HUD has not yet released an updated LMISD dataset for 2026.
If you have any questions about implementing the updated income limits, please contact CDBGapps@TexasAgriculture.gov.
Our Region
The Texoma region is located in north central Texas south of Lake Texoma and the Red River that borders the states of Oklahoma and Texas which includes Cooke, Fannin, & Grayson counties.
Cooke County
Fannin County
Grayson County
Texoma Demographics
Texoma
225,563
Cooke
43,219
Fannin
37,300
Grayson
145,044
Source: Texas Water Development Board Regional Water Plan County Population Projections for 2020-2070
Median Household Income
USA - $75,149
State of Texas - $73,035
Texoma
$62,173
Cooke
$66,374
Fannin
$66,374
Grayson
$54,309
The Median Household Income for Texoma is $62,173, with 14.3% of the population living in poverty, compared to 16% of Texans and 14.6% of Americans. Based on the 2017-2022 American Community Survey 5-Year Estimates, the Median Household Income for Cooke County is $66,374 with 13% of persons living in poverty. The Fannin County Median Household Income is $65,835 with 12.9% of persons living in poverty. The Grayson County Median Household Income is $54,309 with 13.4% of persons living in poverty.
Source: US Census Bureau, 2017-2022 American Community Survey 5-Year Estimates
Gross Rent as a % of Income
Affordability is the relative expenses families and individuals spend on housing in the Texoma region. A general rule of thumb is that families should spend no more than 30% of their monthly income on housing.
Affordability at a Glance - % of Population Spending 30% or More on Housing:
USA - 50.6%
State of Texas - 47.8%
Cooke
40.9%
Fannin
43.4%
Grayson
42.66%
Source: US Census Bureau, 2013-2017 American Community Survey 5-Year Estimates


Meet the Team
Community & Economic Development
Program Staff