Bonham Police Department receives Ballistic Helmets from TCOG
May 3, 2018TCOG’s ADRC Announces New Educational Series
June 6, 20182019-2021 Community Needs Assessment

Key Findings
Correlates (“Causes”) of Poverty
The concept of “causality” in the social sciences is fraught with epistemological, methodological, and statistical issues, not to mention the complex interactions of multiple variables. However, there are several correlates of poverty that can theoretically be placed in a “causal” model; that is, one where antecedent variables can be linked to poverty (in its various forms) as a dependent variable. One such antecedent variable is education; earlier in this report we demonstrated the direct correlation between educational level and poverty. In the sections below, we examine two variables as antecedent to poverty: childhood educational opportunities and high school completion.
Early Childhood Education
The availability and access to early childhood educational opportunities varies greatly in the Texoma region. Table 23, below shows the 2016-2017 school year enrollment, by county, in both Head Start programs and public school Pre-Kindergarten programs. This table does not take into account the number of children enrolled in private pre-kindergarten programs (not daycare). The number of unserved children shown in the table below is probably too high as it does not take into account the number of children in private programs, and the age category is from 0-4. Even with these restrictions, it is evident that there are substantial numbers of children, in each county, who are not served by Head Start or pre-kindergarten programs.
| Table 23: Texoma Head Start and Pre K Enrollment by County | |||||
|---|---|---|---|---|---|
| Texoma Head Start, Pre-K, Enrollment, 2016-2017 School Year | |||||
| County | Head Start Enrollment | Public School Pre-Kindergarten | Total in HS and Pre-K | Total Population 0-4* | Total Population Unserved |
| Fannin | 161 | 338 | 499 | 1,690 | 1,191 |
| Grayson | 1,029 | 828 | 1,857 | 7,531 | 5,674 |
| Cooke | 630 | 182 | 812 | 2,462 | 1,650 |
| Totals | 1,820 | 1,348 | 3,168 | 11,683 | 8,515 |
| Sources: Texas Education Agency, ACS estimates 2012-2016 | |||||
Figure H, below, shows the percentage of children below the poverty level, by census tract, as well as the location of Head Start locations for Fannin County As shown, the two census tracts in the far south-west corner of the county are some of the farthest from the single Head Start program, located in Bonham. Again, the lack of early childhood education, is seen as a problem in this county.
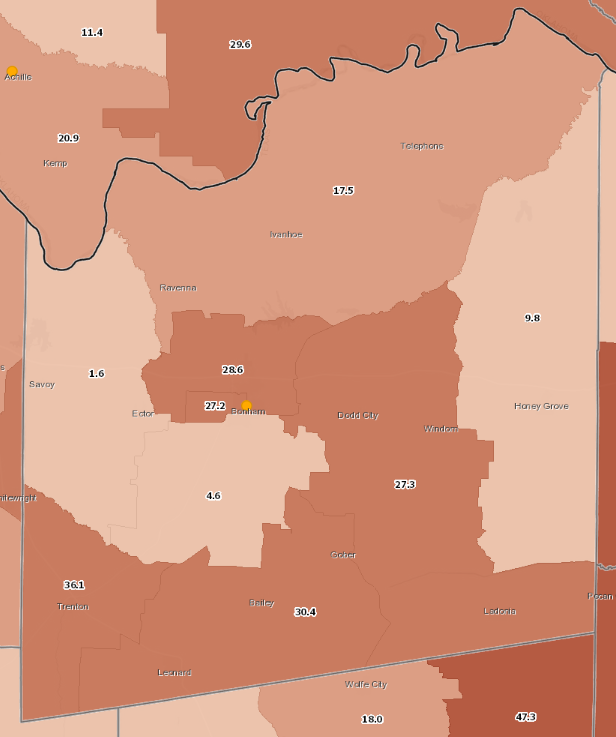
Figure H: Children Age 0-4 Below Poverty Level and Head Start Facilities, Fannin County
Source: Community Commons, ACS 2012-2016, Head Start Facilities, ACF 2018
Figure H1, shown below, shows the percentage of children ages 0-4 living in poverty, by census tract for Grayson County. While Grayson County has five Head Start locations, four are located either in Sherman or Denison. The tracts shown earlier as having the highest percentages of overall poverty, also have the highest percentages of young children in poverty. Not surprising, the tracts having the highest percentage of young children are in east Sherman (49.4 percent in poverty), and in south-east Denison (38.5 percent in poverty).
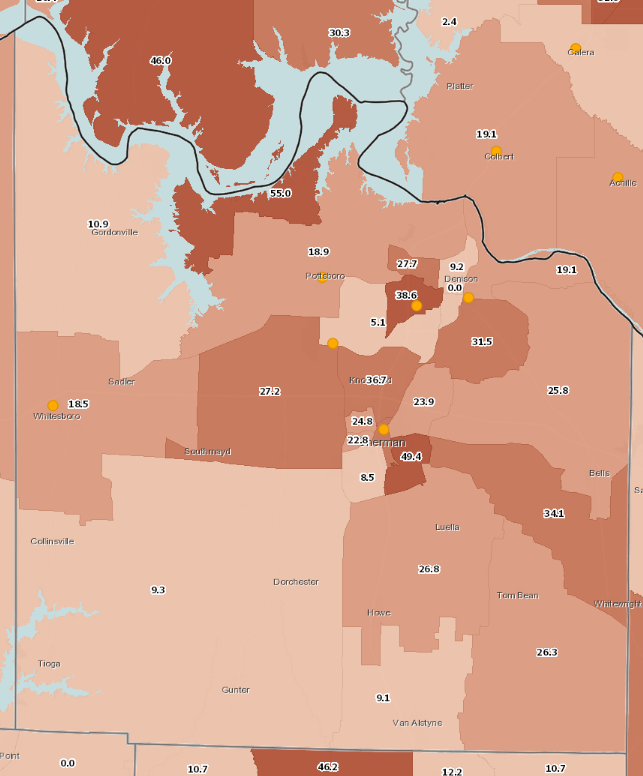
Figure H.1: Children Age 0-4 Below Poverty Level and Head Start Facilities, Grayson County
Source: Community Commons, ACS 2012-2016, Head Start Facilities, ACF 2018
Figure H2, below, shows the percent of children ages 0-4 living in poverty, by census tract, for Cooke County. Cooke County has only one Head Start program location, in Gainesville. Again, the tracts previously identified as having the highest poverty rates in Cooke county, have the highest percentage of children age 0-4 living in poverty. These are the central and south-east tracks in Gainesville, having respectively, 70.4 percent in poverty and 55.0 percent in poverty. Again, the number of children in poverty is overwhelming.
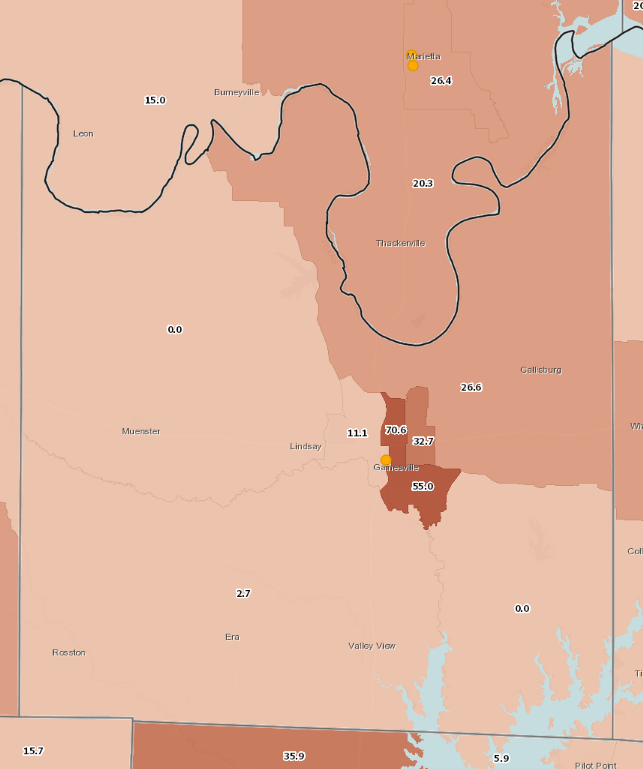
Figure H.2: Children Age 0-4 Below Poverty Level and Head Start Facilities, Cooke County
Source: Community Commons, ACS 2012-2016, Head Start Facilities, ACF 2018
The lack of opportunities, and access, to early childhood education is one of the causal factors for poverty in the Texoma region, and must be addressed to reduce overall poverty in the region.
High School Completion
As shown earlier, having a high-school diploma lowers the probability of poverty. There is a clear correlation between high-school completion and poverty; this is demonstrated in the following Community Commons maps with ACS 2016 dat. Figure I, below, shows the percentage of adults (18 or older), who do not have a high-school diploma, by census tract, for Fannin County. (The higher the percentage, the darker the color). Again, the tract having the highest level of early childhood poverty (above), and identified earlier as the census tract having the highest overall poverty rate, has the highest percentage of adults who don’t have a high-school diploma (35.5 percent), with the two adjacent tracts having percentages of 14.1 and 12.9.
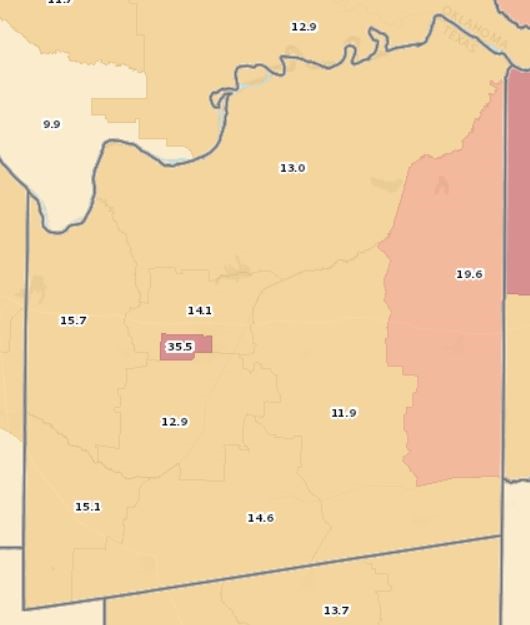
Figure I: Percentage of Adults (18 or Older) Without a High-School Diploma, Fannin County
Source: Community Commons, ACS 2012-2016
Figure I1, below, shows the percentage of adults without a high school diploma, by census tract for Grayson County. Again, the darker the color, the higher the percentage of adults without a high-school diploma. As expected, the tracts identified earlier have the highest percentages of adults without a high-school diploma.
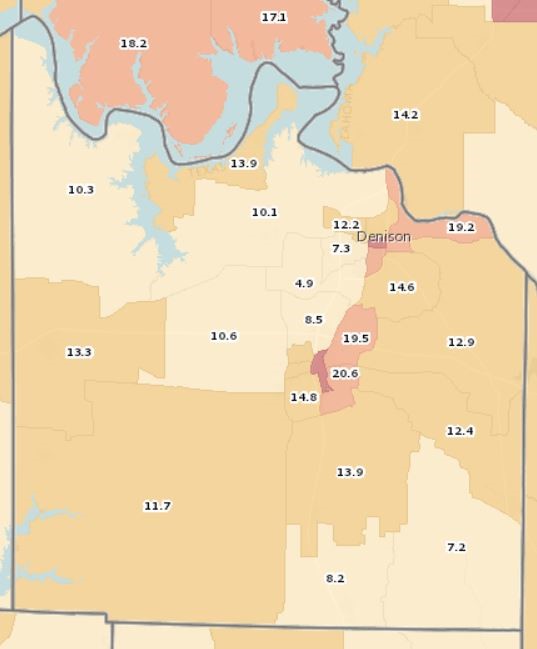
Figure I.1: Percentage of Adults (18 or Older) Without a High-School Diploma, Grayson County
Source: Community Commons, ACS 2012-2016
Figure I1a, below, shows the rates of high-school completion for Sherman. The tract in central Sherman, which has one of the highest rates of poverty in the region, has a very high percentage (34.3 percent) of adults without a high school diploma.
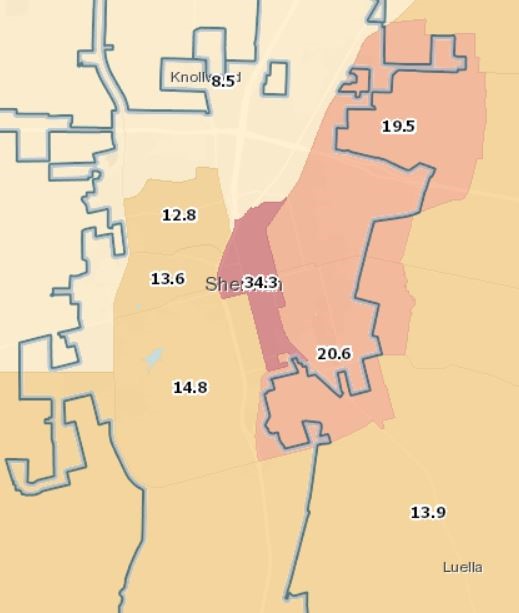
Figure I.1a: Percentage of Adults (18 or Older) Without a High-School Diploma, Sherman
Source: Community Commons, ACS 2012-2016
Figure I2, below, shows the percentage of adults without a high-school diploma, by census tract, for Cooke County. Again, the census tracts with the highest rates of overall poverty are the tracts with the highest percentages of adults without a high-school diploma. The details for Gainesville are shown in Figure I2b, below. The two census tracts encompassing central and south-east Gainesville have 21.5 percent and 20.4 percent, respectively, of adults without a high-school diploma.
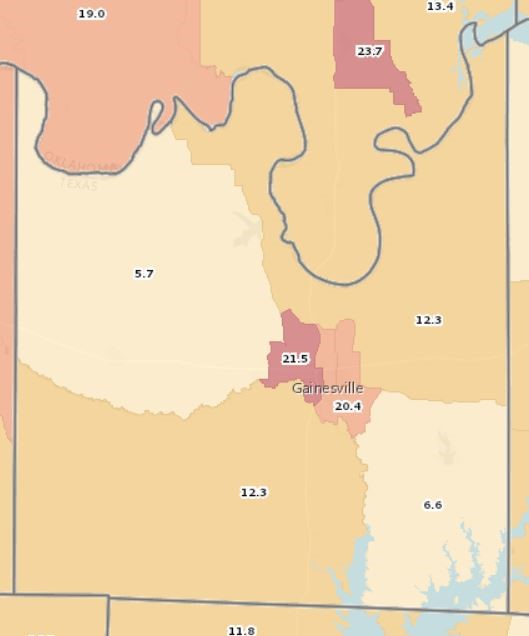
Figure I.2: Percentage of Adults (18 or Older) Without a High-School Diploma, Cooke County
Source: Community Commons, ACS 2012-2016
Figure I2b, below, shows the percentage of adults without a high-school diploma, by census tract, in Gainesville. Again, the tracts with the highest rates of overall poverty have the highest rates of adults without a high-school diploma.
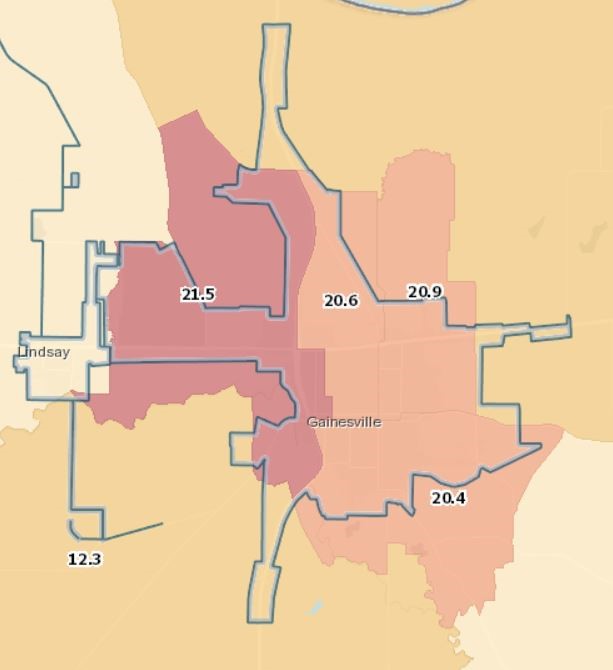
Figure I.2b: Percentage of Adults (18 or Older) Without a High-School Diploma, Gainesville
Source: Community Commons, ACS 2012-2016
Underemployment
Another causal variable for poverty in the Texoma region is underemployment. The Texoma region is currently experiencing functionally full employment (unemployment rate at or below 3 percent). However, as stated earlier, many of the available jobs are part-time, or low-wage. Figure J, below, shows the average yearly individual earnings, by census tract, for Fannin County. Again, the census tract in west Bonham, identified earlier in this report, has the lowest average yearly earnings, $39,000. The tracts adjacent to this high-poverty tract, have average yearly earnings of $62,000 and $63,000.
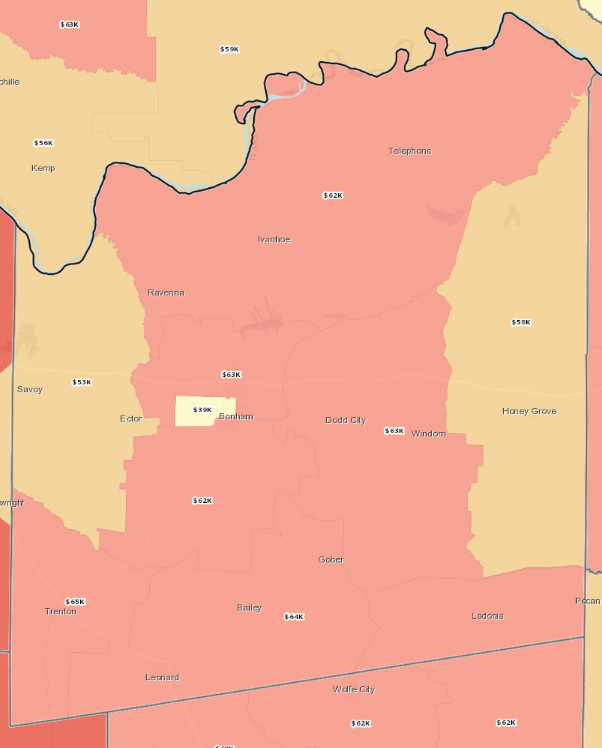
Figure J: Fannin County Average Earnings, ACS 2012-2016
Source: Community Commons, ACS 2012-2016
Figure J1, below, shows the same variable, average individual yearly earnings, by census tract, for Grayson County. The tracts identified early as having the highest rates of poverty have the lowest average earnings (the lighter the color, the lower the average yearly earnings). This implies a strong relationship between underemployment and poverty.
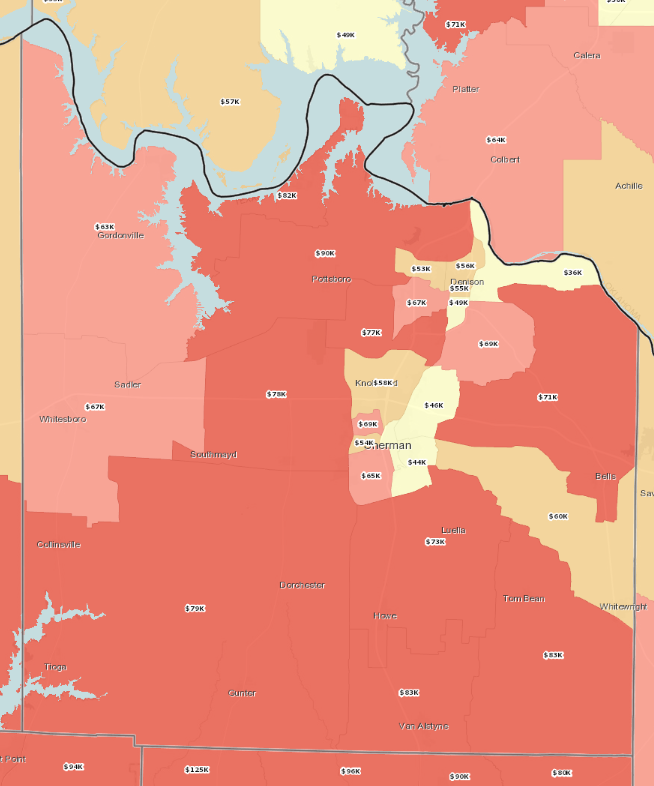
Figure J.1: Grayson County Average Earnings, ACS 2012-2016
Source: Community Commons, ACS 2012-2016
Figure J2, below shows the same pattern for Cooke County. Those tracts identified as having the highest rates of poverty also have the lowest average individual yearly earnings.
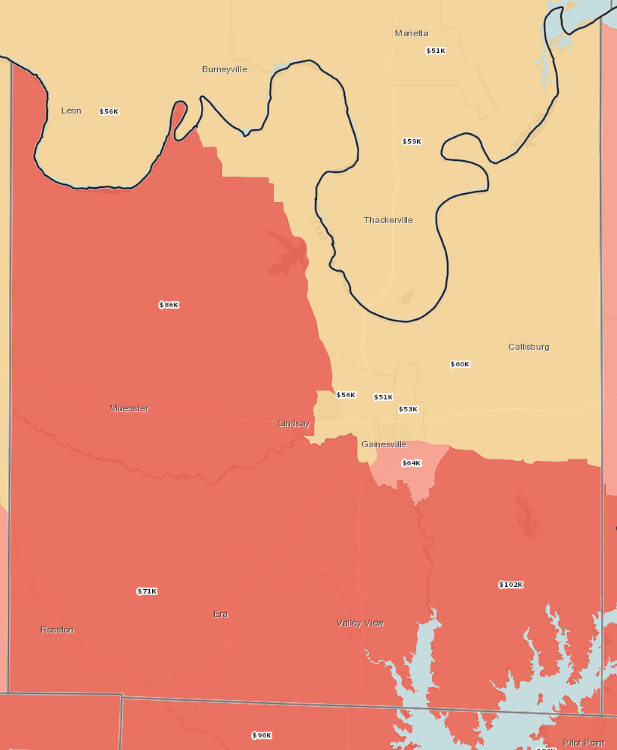
Figure J.2: Cooke County Average Earnings, ACS 2012-2016
Source: Community Commons, ACS 2012-2016
As demonstrated by the maps and data, three major causal factors correlated with poverty are early childhood education, high school completion, and underemployment.
Conditions of Poverty
One of the regional conditions of poverty is housing cost burden, or the percentage of yearly income required to meet the yearly costs of having and maintain housing. Figure K, below, shows the yearly housing cost burden by census tract, for Fannin County. The highest housing cost burdens are found in the census tracts that have the highest rates of overall poverty. The tract in west Bonham has a housing burden of 38.3 percent. The conditions resulting in the lack of availability and access to mental/medical providers and facilities are shown in the tables and maps below.
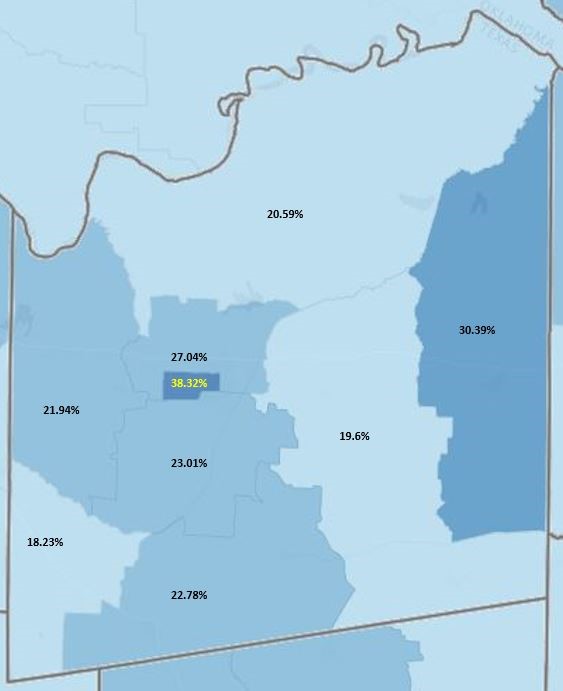
Figure K: Fannin County Housing Cost Burden
Source: Community Commons, ACS 2012-2016
Figure K1, below, shows the housing cost burden, by census tract, for Grayson County. Again, the highest cost burdens are found in the tracts with the highest rates of poverty. The highest is in the central Sherman tract; fully 44 percent of the yearly income goes to housing costs.
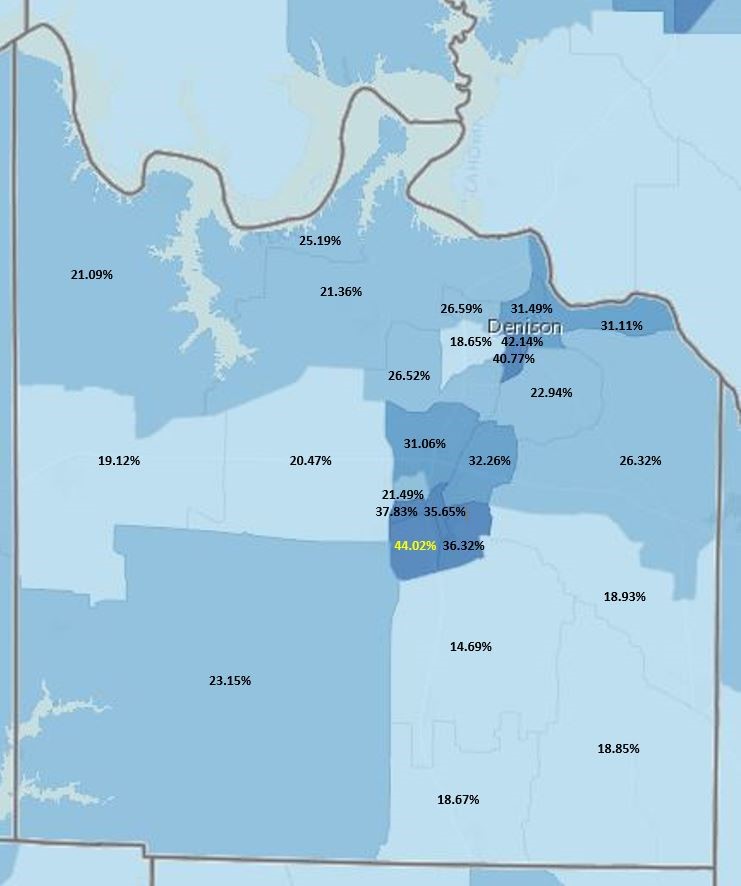
Figure K.1: Grayson County Housing Burden
Source: Community Commons, ACS 2012-2016
Figure K2, below, shows the average yearly housing cost burden, by census tract, for Cooke County. Again the pattern continues; the tracts having the highest rates of poverty have the highest average yearly cost burdens. The tracts in central Gainesville have average yearly housing cost burdens of 39.6 percent and 32.5 percent.
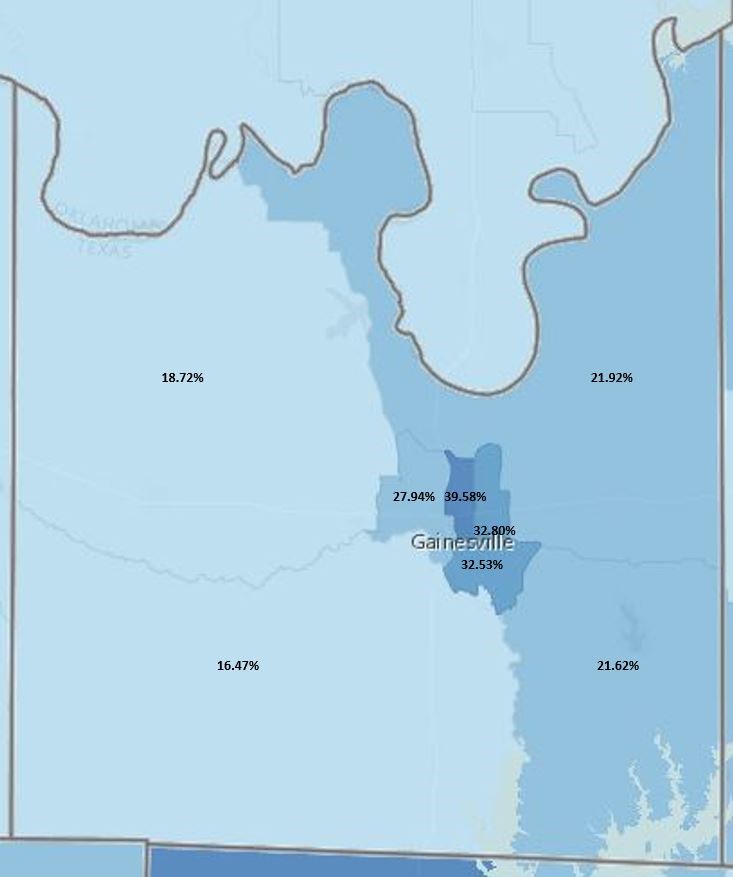
Figure K.2: Cooke County Housing Burden
Source: Community Commons, ACS 2012-2016
As shown, one of the most costly conditions of poverty is paying for housing. As discussed earlier, one of the top needs for the region is the availability of access to safe and affordable housing. All three counties have robust public housing, but the need is much greater than the assets in place. The result is that it is expensive to be poor.
One of top demonstrated needs for the region, identified earlier, is the lack of access to healthcare facilities and providers. The maps below demonstrate the percent of the population, age 18-64 who are uninsured. The legend of Table L, below, states the location of Federally Qualified Health Centers, health facilities dedicated to Medicare and Medicaid patients. There is only one Federally Qualified Health Center in the region, located in Bonham. The pattern is somewhat different than demonstrated in earlier maps; the tract identified as having the highest rate of poverty in Fannin County has the highest rate of uninsured adults (27.3 percent), but other tracts also have high percentages of uninsured adults. This supports the identification of availability and access to healthcare facilities and providers, especially mental healthcare, as one of the top needs for the region. This pattern is found in the following maps showing the uninsured percentages in Grayson and Cooke counties.
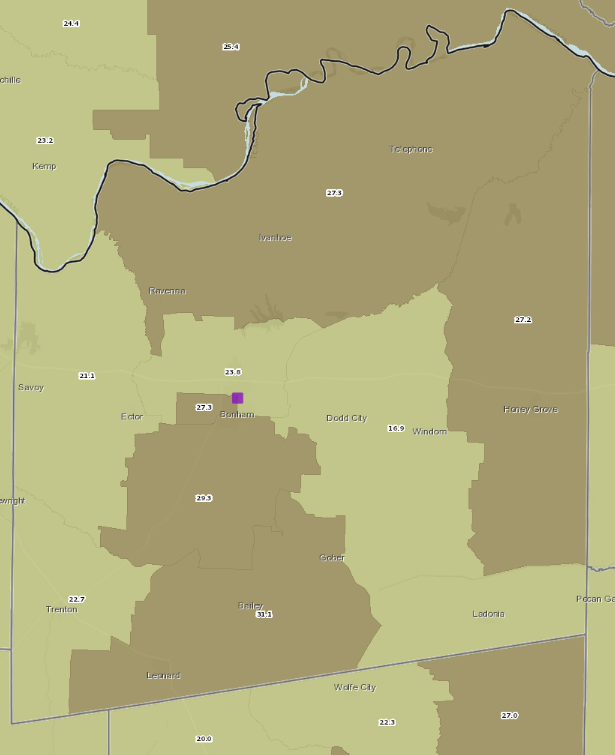
Figure L: Fannin County Uninsured Population, Age 18-64, and Federally Qualified Health Centers, March, 2018
Source: Community Commons, ACS 2012-2016
Figure L1, below, shows the percentage of the adult population who are uninsured, by census tract, for Grayson County. The highest percentages of uninsured adults are found in the tracts identified earlier as having high percentages of poverty. Nearly one-half of the population in one of the tracts in central Sherman is uninsured (49.4 percent).
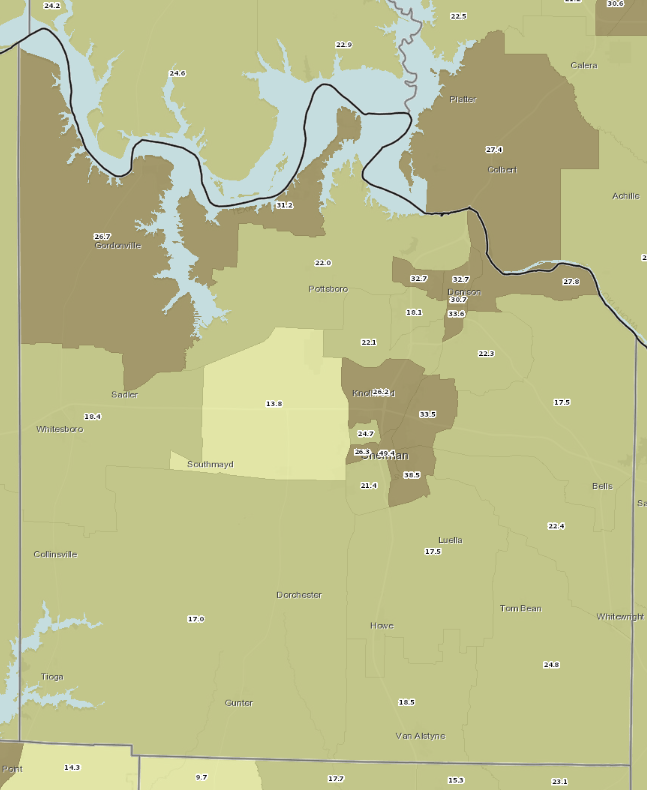
Figure L.1: Grayson County Uninsured Population, Age 18-64, and Federally Qualified Health Centers, March, 2018
Source: Community Commons, ACS 2012-2016
Figure L2, below, shows the uninsured population, by census tract, for Cooke County. Again, the pattern continues, with high-poverty tracts having high percentages of the adult population who area uninsured.
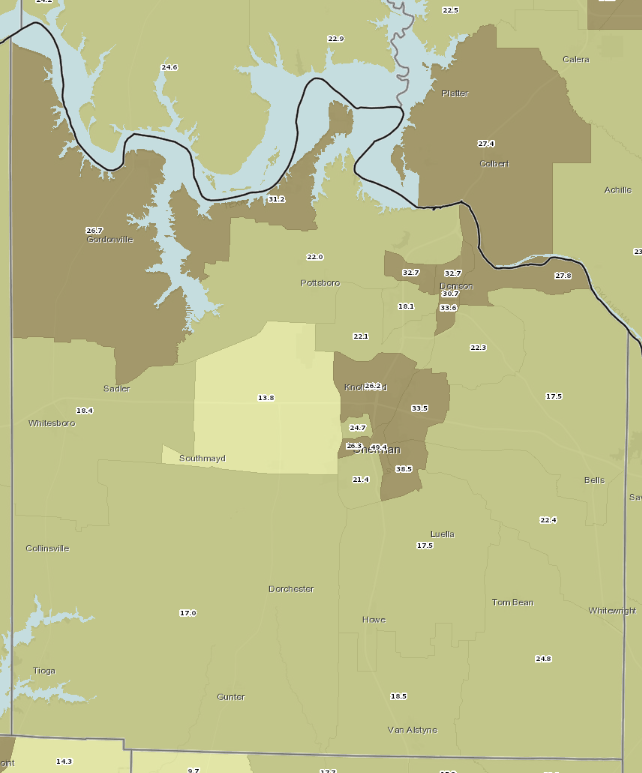
Figure L.2: Cooke County Uninsured Population, Age 18-64, and Federally Qualified Health Centers, March, 2018
Source: Community Commons, ACS 2012-2016
The findings above showing a higher percentage of uninsured in high poverty tracts supports the identified need of access to healthcare facilities and providers.
Food Insecurity
One of the major factors indicating the need for supplemental food, as well as contributing to the overall health of individuals and families is the number of families receiving Supplemental Nutrition Assistance (SNAP). The size of a family’s SNAP benefit is based on its income and certain expenses. After the allowed expenses are deducted from the gross family income, the family must be at or below the poverty level. Figure L, below, shows the percentage of working families receiving SNAP, by census tract, for Fannin County. (The darker the color the higher the percentage of working families receiving SNAP). Again, the pattern continues; the high poverty census tracts also have the highest percentages of working families receiving SNAP. These are the working poor, or, as shown earlier, the underemployed, who need assistance to have nutritious food.
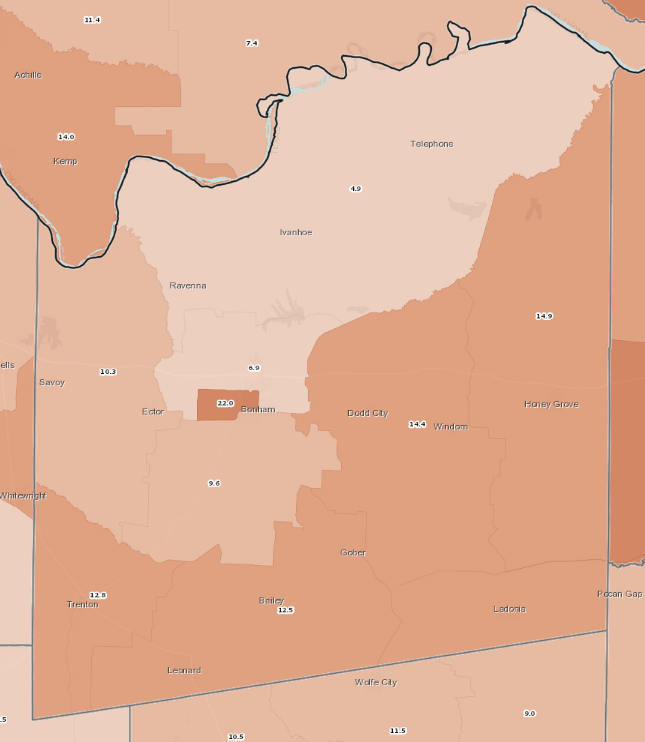
Figure M: Fannin County Working Families Receiving SNAP
Source: Community Commons, ACS 2012-2016
Table M1, below, demonstrates the percentages of working families receiving SNAP, by census tract, for Grayson County. Again, the high poverty tracts have the highest percentages of working families receiving SNAP.
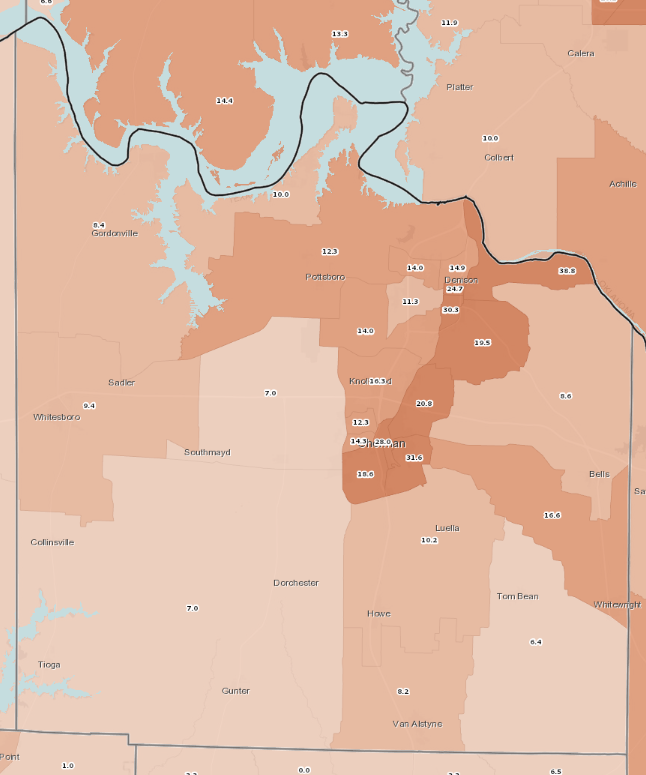
Figure M.1: Grayson County Working Families Receiving SNAP
Source: Community Commons, ACS 2012-2016
Table M2, below, shows the percentage of working families receiving SNAP, by census tracts, for Cooke County. Again, the highest percentages of working families receiving SNAP are found in the high poverty tracts.
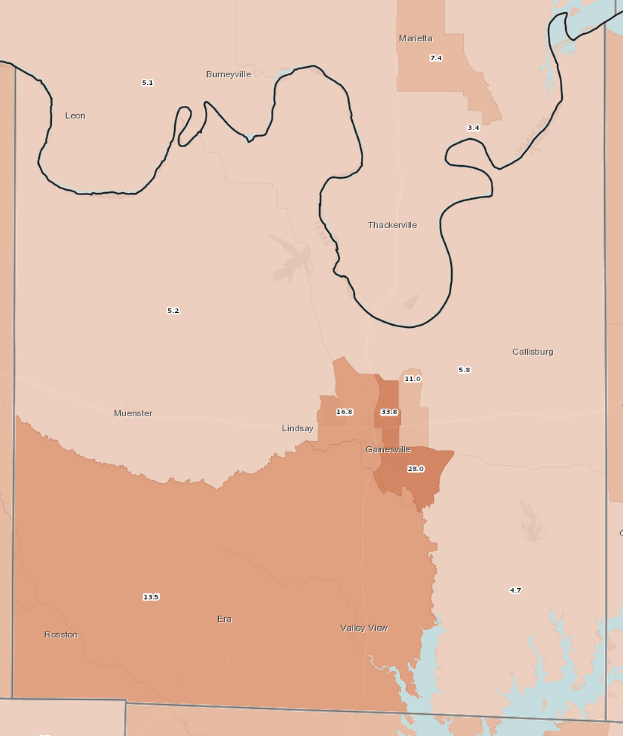
Figure M.2: Cooke County Working Families Receiving SNAP
Source: Community Commons, ACS 2012-2016
Transportation
Another condition of poverty in the Texoma region is the number of households having no vehicle. These households must rely on limited public transportation, friends or family. Figure N, below, shows the percentage of households with no vehicle, by census tract, for Fannin County (the darker the color, the higher the percentage of households with no vehicle). Again, the high poverty census tracts have the highest percentage of households with no vehicle. Thus those with the highest needs have the most limited access to transportation.
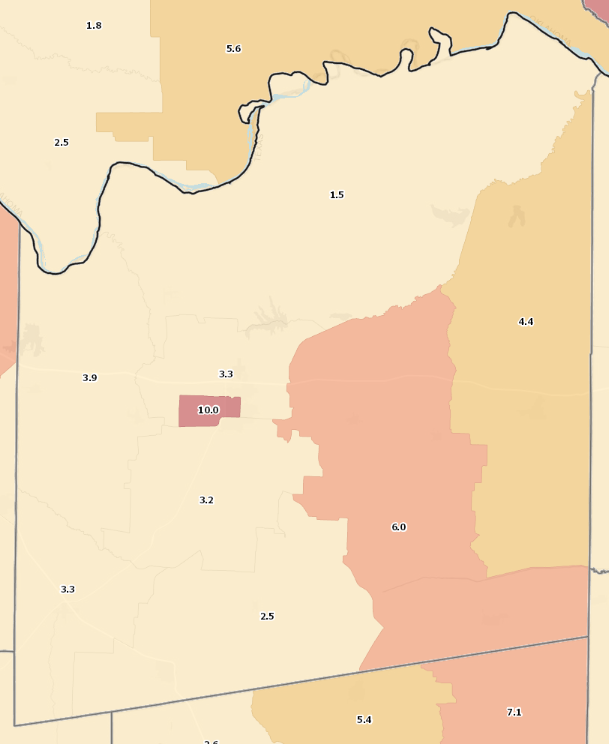
Figure N: Fannin County Households with No Vehicle
Source: Community Commons, ACS 2012-2016
Figure N1, below, shows the percentage of households having no vehicle, by census tract, for Grayson County. The pattern continues; the households in high poverty census tracts are less likely to have a vehicle.
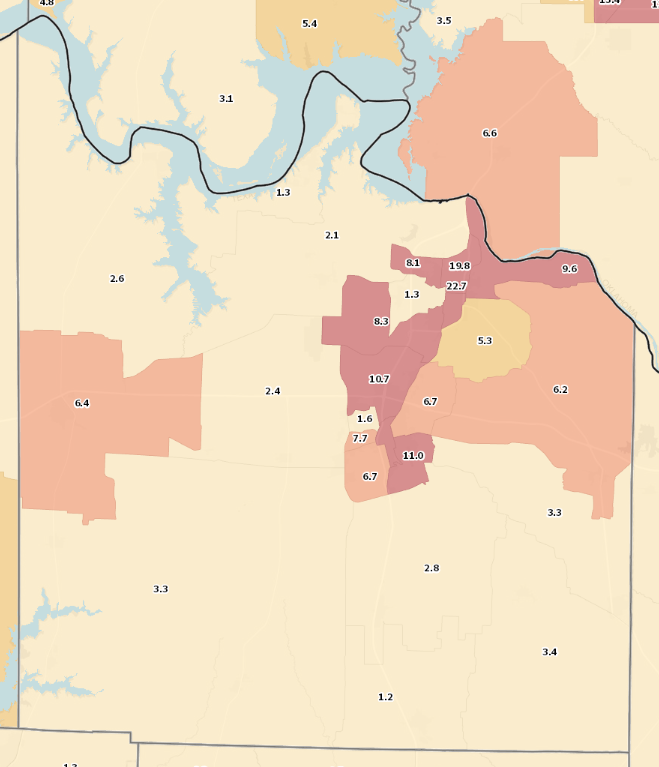
Figure N.1: Grayson County Households with No Vehicle
Source: Community Commons, ACS 2012-2016
Figure N2, below, shows the percentage of households with no vehicle, by census tract, for Cooke County. Again, the highest percentages of households with no vehicle are found in the high poverty tracts.
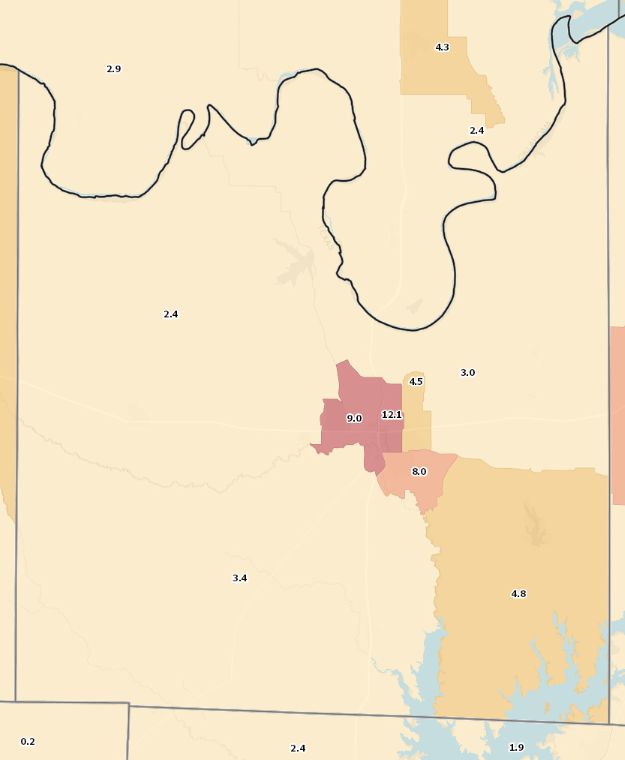
Figure N.2: Cooke County Households with No Vehicle
Source: Community Commons, ACS 2012-2016